Today we will be diving deeper into classification models that have real-world use.
What we learned from the previous lesson was just some of the basics of supervised learning. Many of the concepts that we have learned in the past will be applied again, and you will see it’s always a constant improvement of techniques in machine learning.
The content is not exhaustive and additional learning will be on your own since there are always new models to learn.
Introduction to Support Vector Machine (SVM)
Let’s open up the file(s) in the 01-Ins_SVM folder to get started.
Why SVMs?
Linear classification has a problem with outliers, because it cannot identify an easy way to reduce errors outside of using R2 or coefficient of determination. SVMs allow error thresholds that may help us to classify correctly even with extreme outliers.
Supposed we want to categorize data points into 2 labels. Let’s say we want to classify between cats and dogs, and we are classifying them based on height and weight.
In linear classification, we use a line to distinguish 2 entities. As a general rule of thumb, dogs are bigger and heavier than cats.
However, what about outliers? How do deal with mini poodles that can be extremely small? They would be labeled as cats if we use a hard line to model.
Thus, the use of SVMs is to address outliers so that we minimize the impact of outliers that could misalign our model.
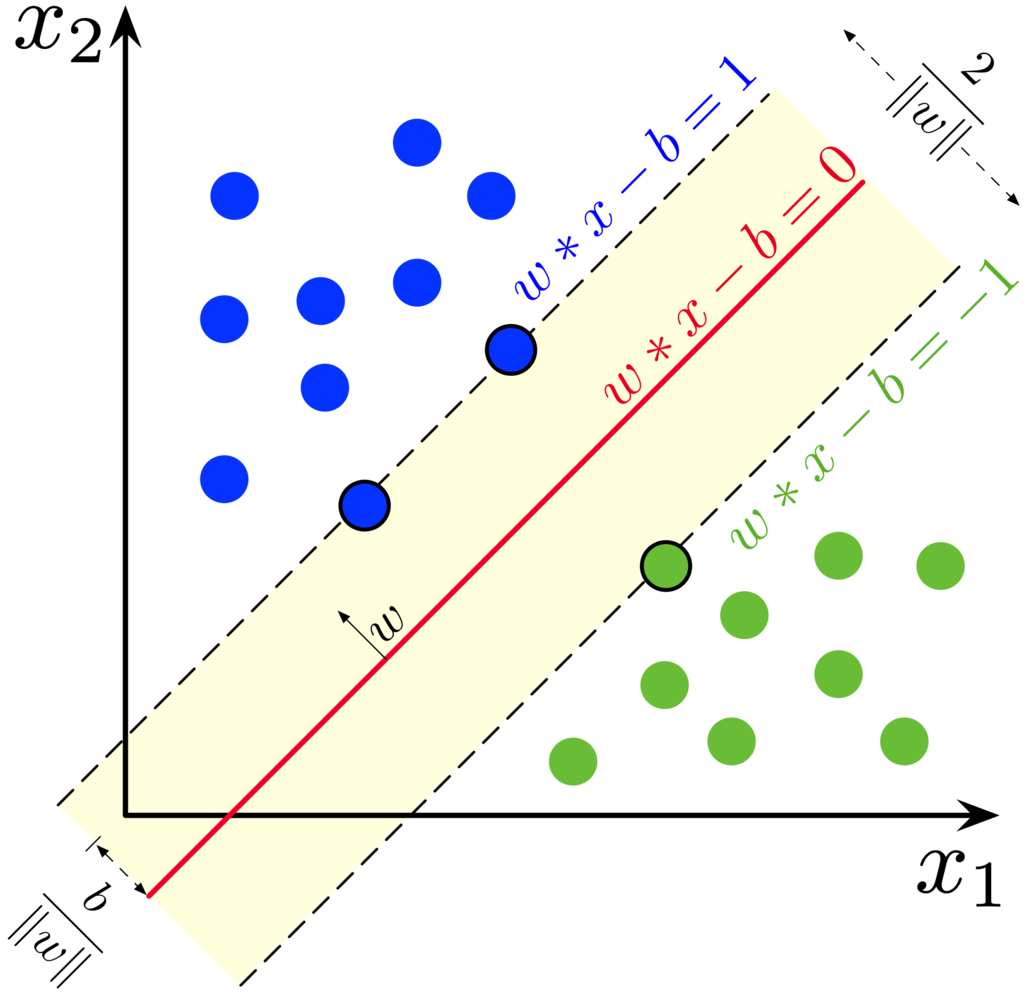
In the example above, the yellow area presents a soft margin where we allow misclassifications to happen. We can allow misclassifications because we expect the misclassifications to be an exception rather than the norm.
- The line in between the dashed lines is called the maximum margin classifier. In linear classification, we use this line to make a distinction between our 2 labels.
- A soft margin classifier is also known as a support vector classifier.
- Support vector classifier is derived where the observations on the edge and within the soft margin are called support vectors.
- The data points on the dashed lines are called support vectors, because these data points serve as the boundaries of where we define the soft margin.
- If we have 2 dimensions, the support vector would be a line, as seen in your activities. If it is 3D, it will be a plane rather than a line. When you are predicting 4 or more dimensions, the support vector classifier is a hyperplane.
- But for simplicity sake, we call the support vector classifier as a hyperplane irregardless of the number of dimensions.
Additional Instructions
Students Do: Predict Occupancy of Office Space
Let’s open up the file(s) in the 02-Stu_Predicting_Occupancy folder to get started.
You will not be able to plot the graph since the dataset has more than 3 dimensions.
Introduction to Decision Trees
Let’s open up the file(s) in the 03-Ins_Decision_Trees folder to get started.
In layman terms, decision trees is a massive if-else algorithm that compares across all your input features to classify the data.
For example, we have a table such as this:
| Weight (kg) | Height (cm) | Classification |
|---|---|---|
| 4.4 | 46 | cat |
| 20 | 68 | dog |
So a decision tree could look like:
- If the animal is < 4.4kg and < 46 cm, it is a cat.
- If the animal is > 20kg and > 68 cm, it is a dog.
The model will build a tree and its nodes with full of if-else statements by themselves, and based on the trained data set, attempt to capture pattern and predict accordingly with the features of an unknown animal.
Decision trees need to be pruned, which is to weigh the features and reduce the number of features needed.
- Because decision trees are very susceptible to overfitting, where your tests might yield good results, but your real-world experience with the model yields poor results.
Additional References
Students Do: Predicting Fraudulent Loan Applications
Let’s open up the file(s) in the 04-Stu_Predicting_Fraud folder to get started.
Random Forest
Let’s open up the file(s) in the 05-Ins_Random_Forest folder to get started.
Intro to Ensemble Learning
In layman terms, you are combining multiple models and/or algorithms to improve accuracy.
For example, Amazon wanted to label brands on images, because there are millions of items sold in the store. It can be used to address erroneous uploads, or fraud.
However, many brands have different styles of logos, and it is not consistent.
- Addidas sometimes use 3 stripes as their brand, and then they will have their name on it.
- Apple just shows an image.
Amazon tried to apply image classification on the entirety of the photo, but it yielded poor results.
They eventually separated the name and the logo, and classify separately before combining their results together to predict the final outcome. This is known as stacking ensemble.
Random forest looks very similar to a decision tree, except that they added sampling, and will break down a big decision tree into several smaller ones for a better accuracy.
Students Do: Predicting Loan Default
Let’s open up the file(s) in the 06-Stu_Predicting_Default folder to get started.
K-Nearest Neighbors
Let’s open up the file(s) in the 07-Ins_KNN folder to get started.
The concept of KNN is easy because it is very similar to K-means clustering, where they will measure the distance between each other and classify according to proximity.
The only difference is you know what you want to label, whereas K-means you won’t know. Because you already know how many labels you want (since there is a correct answer), there’s no need to determine the optimal number of clusters here.
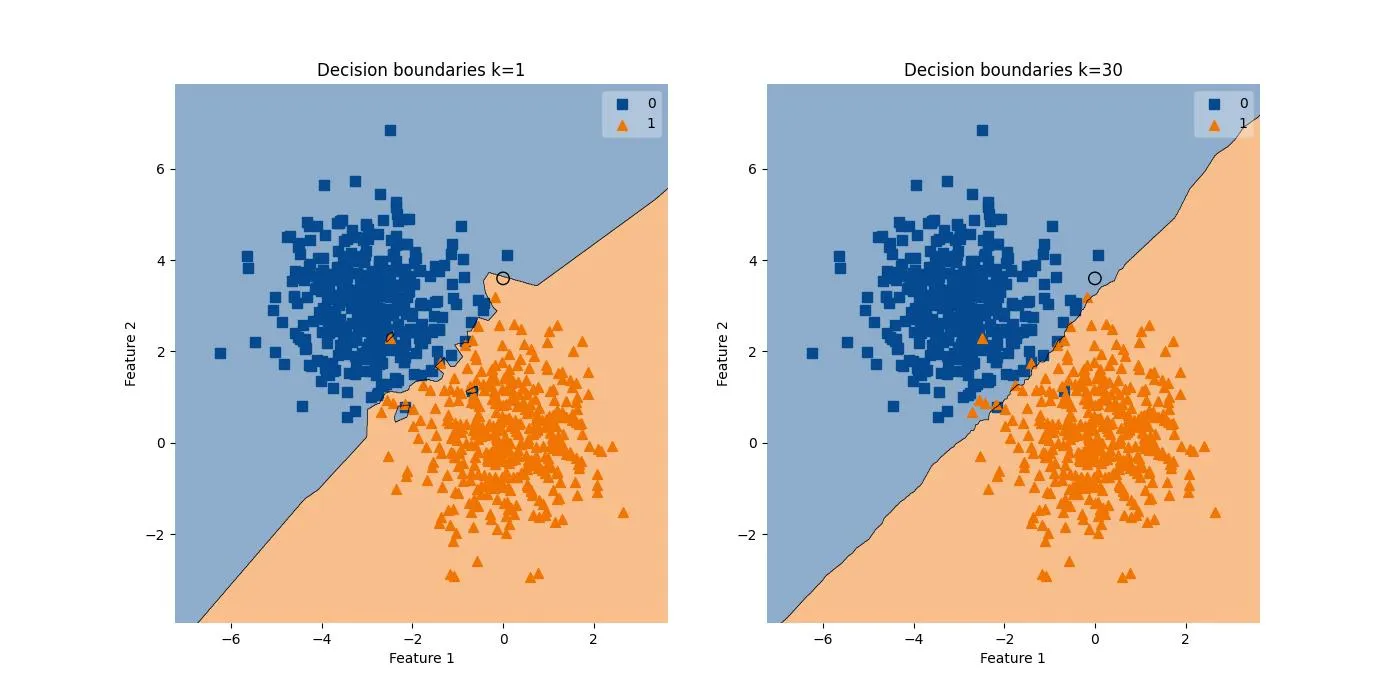
FYI – n_neighbors parameter
This is not to define the number of clusters within a dataset, as the number of labels to define is clearly indicated within the training data.
This is a model optimization feature to group the number of data points in one iteration, and it variates on the accuracy of the model.
KNN is a lazy learner that does not build a model during the training phase. It memorizes the entire training dataset and performs action on the dataset at the time of classification. Thus, KNN is computationally expensive and can be time-consuming.
By being able to tweak the number of data points, we can optimize the performance of the model by sacrificing some accuracy and precision.
We can optimize the number of neighbors by a process called hyperparameter tuning, and one of the methods of hyperparameter tuning is the Grid Search algorithm. However, this is beyond the scope of the lesson.
Students Do: Predicting Banking Customers
Let’s open up the file(s) in the 08-Stu_Predicting_Bank_Customers folder to get started.
What makes a data scientist?
Unsupervised and supervised learning presents the foundational elements of what it means to be a data scientist. Everything else builds on these fundamentals, such as reinforcement learning and deep learning.
Why so many methods and algorithms?
Because your business context is unique, and your role as a data scientist is to be able to experiment and explore the best possible model that leads to the greatest value and impact to the business outcome.
A data engineer’s role is similar to building a bridge, or a building. The constructs of a building are already defined and there is little flexibility because the laws of physics are absolute.
However, a data scientist role isn’t as straightforward. You’ll need enough coding skills to prepare and preprocess data, as well as business acumen to explore different approaches to solving a business case. The sky is the limit in terms of innovation and experimentation, but it also means you’re not always sure of succcess with each modeling. You’ll have to keep learning and experimenting to grow your skill sets.
Thus, if you would like to consistently explore and find ways to experiment to get the best outcomes, then being a data scientist is for you. This also means it is a never-ending journey of learning.

