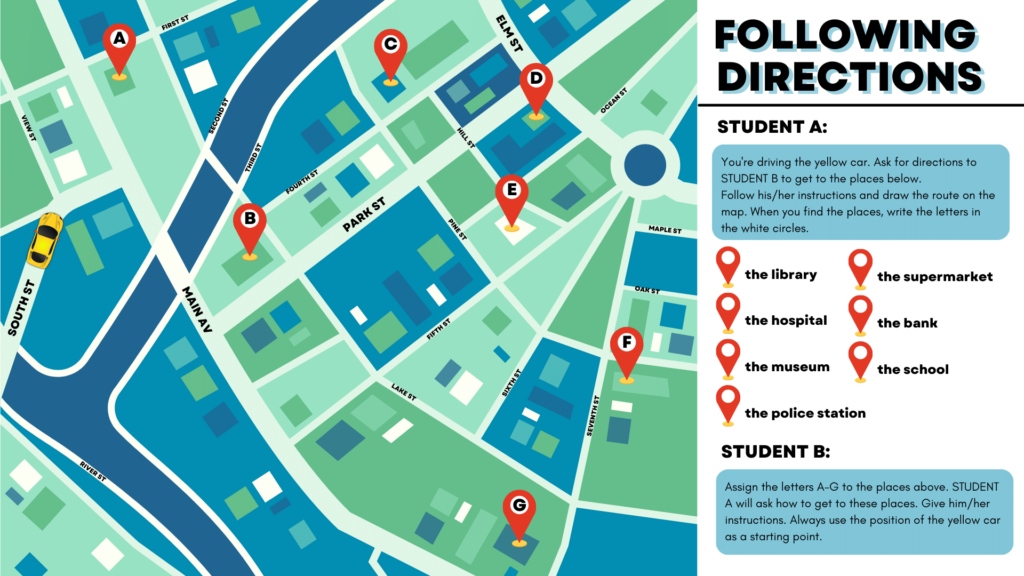
Visualizing data on maps is both challenging and rewarding, especially if the business product or company handles a lot of map data.
Data visualization on maps isn’t for every industry, because even if your company has a global presence, you only need maps when your product is sensitive to geocoordinates. For example:
- PlayStation may sell products across the globe, but they don’t necessarily need maps as a prerequisite to sell products.
- You can break down sales data via countries without maps.
- Fedex, DHL, Amazon or other logistical companies truly need maps because of fuel cost and the potential delays due to traffic jams etc.
- Some ex-students worked in a mining company. Others in real estate. They may need maps.
- One of my ex students was working with a company that sell services for parking lots, and they buy parking lots as business opportunities.
Thus, data visualization on maps isn’t for everyone. Do pick out what you care about in your career or job search if this is something you want to dive in.
Demo on why visualization on maps matter: https://droughtmonitor.unl.edu/
In today’s lesson, you’re learning the basics of how to create maps and visualize data on them.
Introduce Leaflet and Create Our First Map
Let’s open up the file(s) in the 01-Ins_Basic_Map folder to get started.
Leaflet quick-start guide: https://leafletjs.com/examples/quick-start/
Add Markers to the Map
Let’s open up the file(s) in the 02-Ins_Markers folder to get started.
What are markers?
They are interactive labels on a map that points to a specific area or location.

Leaflet marker ref: https://leafletjs.com/reference.html#marker-option
Students Do: Complete a Quick Labeling Exercise
Let’s open up the file(s) in the 03-Stu_City_Markers folder to get started.
Add Other Types of Markers
Let’s open up the file(s) in the 04-Ins_Other_Markers folder to get started.
Leaflet API ref: https://leafletjs.com/reference.html
- Circle: https://leafletjs.com/reference.html#circle
- Polygon: https://leafletjs.com/reference.html#polygon
- Polyline: https://leafletjs.com/reference.html#polyline
- Rectangle: https://leafletjs.com/reference.html#rectangle
Students Do: Add Other Types of Markers
Let’s open up the file in the 05-Stu_Other_Markers folder to get started.
Visualize City Populations
Let’s open up the file(s) in the 06-Ins_City_Population folder to get started.
Students Do: Visualize World GDP Per Capita
Let’s open up the file(s) in the 07-Stu_Country_GDP folder to get started.
Demonstrate Layer Groups and Layer Controls
Let’s open up the file(s) in the 08-Ins_Layers folder to get started.
Layers and layer groups are an efficient way to decouple data groups within a map.
Let’s say you have different sets of data that you want to display on the map, such as:
- Restaurant markers
- Gas station markers
- Routes and toll prices
If you group them as one big bucket and try to modify the restaurant marker, you might affect the gas station markers.
Layers provide a way to divide-&-conquer data visualizations within a map so that you can:
- Divide work among teams and individuals.
- Isolate problems efficiently and effectively.
Layers is popularized by Photoshop, and if you have experience in any design tools, it is using the same concept except that we are running JS code on it.
Layer Groups and Layers Control ref: https://leafletjs.com/examples/layers-control/
Students Do: Perform a Layer Activity
Let’s open up the file(s) in the 09-Stu_City_Population_Layers folder to get started.
Students Do: Perform a GeoJSON Activity
Let’s open up the file(s) in the 10-Stu_GeoJson folder to get started.
GeoJSON is a specific type of JSON data that is standardized across industries and business to provide an efficient way of communication across different systems and apps. We don’t want to keep modeling against a new data structure everytime we construct a JSON file or data payload.
In it’s essence, it is just another JSON data format. However, GeoJSON is recognized and preferred if you’re wanting to dive deep into data visualization with maps.
Sample GeoJSON data: https://earthquake.usgs.gov/earthquakes/feed/v1.0/summary/all_hour.geojson
Leaflet GeoJSON ref: https://leafletjs.com/examples/geojson/

